
As in any business, understanding user behavior is crucial for website and app owners. Google Analytics 4 (GA4), the latest iteration of Google’s powerful analytics platform, offers a comprehensive suite of tools to help beginners navigate the intricacies of web analytics and gain valuable insights.
This comprehensive guide to Google Analytics 4 (GA4) is designed specifically for beginners to discover how to set up a GA4 account, track website data, measure key metrics, and gain valuable insights into user behavior.
You will learn how to:
- Set up a GA4 account and track website data
- Measure key metrics such as page views, sessions, and bounce rate
- Track user interactions beyond page views, such as button clicks and video plays
- Set up custom reports in GA4
- Interpret data in GA4 reports
- Track form submissions in GA4
- Answer frequently asked questions about GA4
Let’s get started!
Table of Contents
- GA4 Basics for Beginners
- GA4 Basics: Understanding the Fundamentals
- 6 Most Important Reports in GA4
- Interpreting Data in GA4 Reports
- What is GA4 Enhanced Measurement
- What is the Best Way to Learn GA4?
- Google Analytics 4 Glossary
GA4 Basics for Beginners
Google Analytics 4 (GA4) is the latest version of Google’s web analytics platform, and it offers a number of powerful new features that can help you track your website traffic and measure your marketing performance.
But you can’t learn how to use it without creating an account!
If you haven’t yet created an account, this easy GA4 setup guide will show you how to set up a GA4 account in no time! Or, if you feel like a pro – I wrote five quick steps right below:
- Create a Google Analytics account
- Create a GA4 property
- Add a data stream
- Install the global site tag
- Test your GA4 setup
That’s it! Now that your account is functional and working, let’s dive into what GA4 is, it’s reports, and how to use it for your SEO strategies.
GA4 Basics: Understanding the Fundamentals
Before diving into the intricacies of Google Analytics 4 (GA4), it’s essential to grasp the fundamental terms that is “web analytics”.
The terminology below are important to remember, as they will help you understand what each report is about – enabling you to make data-driven decisions to improve your website’s performance.
Core Analytics Terms:
- Pageviews: Imagine each page on your website as a window into your online presence. Every time a visitor opens one of these windows, it’s counted as a pageview. Tracking pageviews provides a basic measure of how much traffic your website is generating.
- Sessions: Consider each visitor’s journey through your website as a unique session. A session encompasses a series of interactions, typically within a set time frame, such as 30 minutes. Tracking sessions helps you understand how long visitors are engaging with your website and how many sessions they’re generating.
- Bounce Rate: Picture a visitor landing on your homepage and promptly leaving without exploring further content. That’s a bounce. The bounce rate measures the percentage of single-page visits, indicating how quickly visitors are abandoning your website. A high bounce rate suggests that your content isn’t captivating enough to encourage further exploration.
- User Engagement: Engagement goes beyond simply visiting pages; it’s about the depth and quality of a user’s interaction with your website. Metrics like time spent on site, pages per session, and bounce
Now that you are aware of the important terms, let’s look into the reports.
6 Most Important Reports in GA4
Google Analytics 4 (GA4) offers a comprehensive suite of reports, each providing valuable insights into your website’s performance and user behavior.
Every beginners should familiarize themselves with these six essential reports:
1. User Explorer: Delving into the Demographics of Your Audience
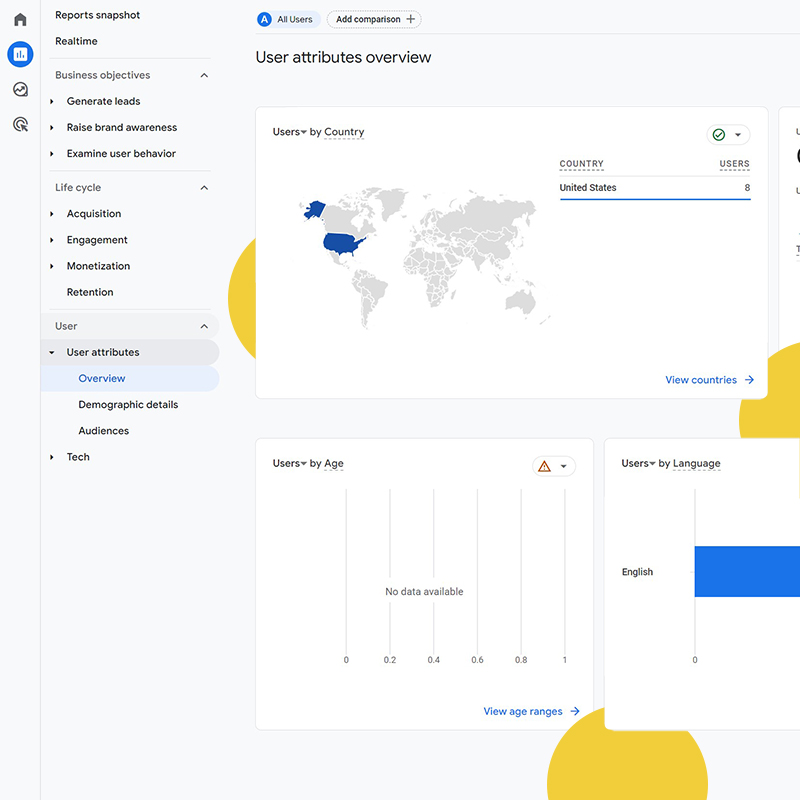
The User Explorer report provides a comprehensive overview of your website’s visitors, revealing their demographics, interests, and behavior patterns. Understanding your target audience is crucial for tailoring your content, marketing campaigns, and website design to their preferences.
Steps to Use the User Explorer Report:
- Access the Report: Navigate to the “Reports” section in your GA4 account. Under User, select “Over View”. (Or view report cards in “Reports Snapshot” within Reports.)
- Explore Demographics: Analyze the demographics of your visitors, such as age, gender, location, and language. Identify the predominant segments of your audience to tailor your messaging and content accordingly.
- Uncover Interests: Examine the interests of your visitors based on their browsing behavior and interactions with specific content categories. This information can guide your content creation and marketing strategies.
- Analyze Device Usage: Understand how users access your website or app across different devices, such as desktops, mobile phones, and tablets. Optimize your website and app for each device to ensure a seamless user experience.
- Track User Behavior: Monitor user engagement metrics, such as time spent on site, pages per session, and bounce rate. Identify areas for improvement to enhance user engagement and reduce bounce rates.
2. Events: Tracking User Interactions beyond Page Views
While page views provide a basic understanding of user activity, GA4’s Events report goes a step further. It tracks specific user interactions, such as button clicks, video plays, and form submissions.
This granular data allows you to measure the effectiveness of your website elements, identify areas for improvement, and optimize the user experience.
Steps to Use the Events Report:
- Access the Report: Navigate to the “Reports” section in your GA4 account and select “Events” under the “Engagement” tab.
- Review Event Categories: Observe the different categories of events that are being tracked on your website or app. Identify the key events that represent user actions you want to measure.
- Analyze Event Metrics: Assess the amount of events for each category to understand which interactions are most prevalent among your users.
- Measure Event Effectiveness: Evaluate the effectiveness of specific events by analyzing metrics such as average event duration, event completion rate, and conversion rate.
- Identify Areas for Improvement: Use the data to identify areas where you can improve user engagement and optimize your website or app elements for better interaction.
3. Conversions: Measuring the Success of Your Marketing Efforts
Conversions are the ultimate measure of your marketing efforts.
They represent the successful completion of desired actions, such as purchases, sign-ups, or downloads.
Tracking conversions allows you to assess the effectiveness of your marketing campaigns, identify high-performing channels, and optimize your marketing strategy.
Steps to Use the Conversions Report:
- Access the Report: Navigate to the “Reports” section in your GA4 account and select “Overview” under the “Engagement” tab.
- Define Conversion Events: Clearly define the conversion events that represent the desired outcomes for your website or app.
- You can define these in the Admin settings. Go to “Admin”, and create an “Events” under Data Display. Once created, go to “Conversions” under Data Display and select “Mark as Conversion” by the event name.
- Events: In GA, events are actions happening on your website that you would like to keep track of.
- Analyze Conversion Volume: Monitor the volume of conversions over time to track the overall success of your marketing efforts.
- Identify Conversion Channels: Assess the effectiveness of different marketing channels by analyzing conversion rates for each channel.
- Optimize Conversion Funnel: Analyze the conversion funnel to identify steps where users are dropping off and implement improvements to increase conversion rates.
How to define conversion events in GA4:
- Identify your business objectives: What are the most important things you want visitors to achieve on your website or app?
- List the actions visitors can take to achieve your objectives: These are your potential conversion events.
- Prioritize your conversion events: Not all conversion events are equally important. Decide which events are most valuable to your business and focus on those.
- Set up your conversion events in GA4: You can do this by creating custom events in the GA4 interface under Admin as stated above.
- Test and refine your conversion events: Once you have set up your conversion events, it is important to test and refine them over time. This will help you ensure that you are tracking the most accurate and valuable data.
Here are some tips for defining conversion events in GA4:
- Use clear and concise names for your conversion events.
- Track both micro-conversions and macro-conversions. Micro-conversions are smaller actions that lead to macro-conversions. For example, a micro-conversion might be adding an item to a shopping cart, while a macro-conversion would be completing a purchase.
- Use event parameters to track additional information about your conversion events. For example, you might track the product that was purchased or the source of the traffic that led to the conversion.
- Parameters: In GA4, parameters are an additional piece of information that is attached to events or user properties. They provide more detail about these. EX: The Event “add_to_cart” might have parameters like “product_id” and “product_name”.
- Test your conversion events to make sure they are working correctly.
Here are some examples of conversion events:
- Ecommerce: Purchase, add to cart, checkout, product page view
- Lead generation: Form submission, email signup, phone call
- Content marketing: Blog post view, video view, download
- App: App install, app open, in-app purchase
For beginners who are new to GA4, there are a number of resources available to help you learn more about conversion events:
By following these steps, you can easily define conversion events in GA4 and start tracking the success of your website or app.
4. User Lifecycle: Understanding the User Journey
The User Lifecycle reports provide insights into the different stages of the user journey, from initial acquisition to engagement and retention.
Running the User Lifecycle reports in GA4 are a straightforward process, but the specific steps depend on whether you chose specific business objectives during setup or opted for the default reports.
Here’s a breakdown:
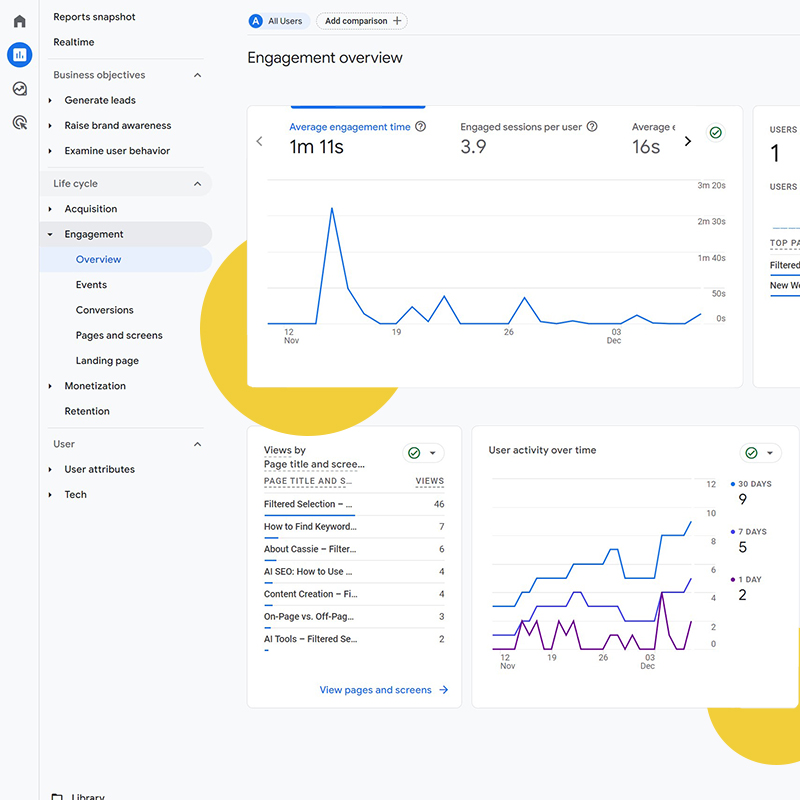
- Open Reports: Click “Reports” in the left-hand navigation menu.
- Choose the Life Cycle Collection: Click on “Life cycle.”
- View Engagement Overview: Click on “Engagement” then “Overview.”
- This provides report cards on important engagement activates happening like session duration, bounce rate, and active users.
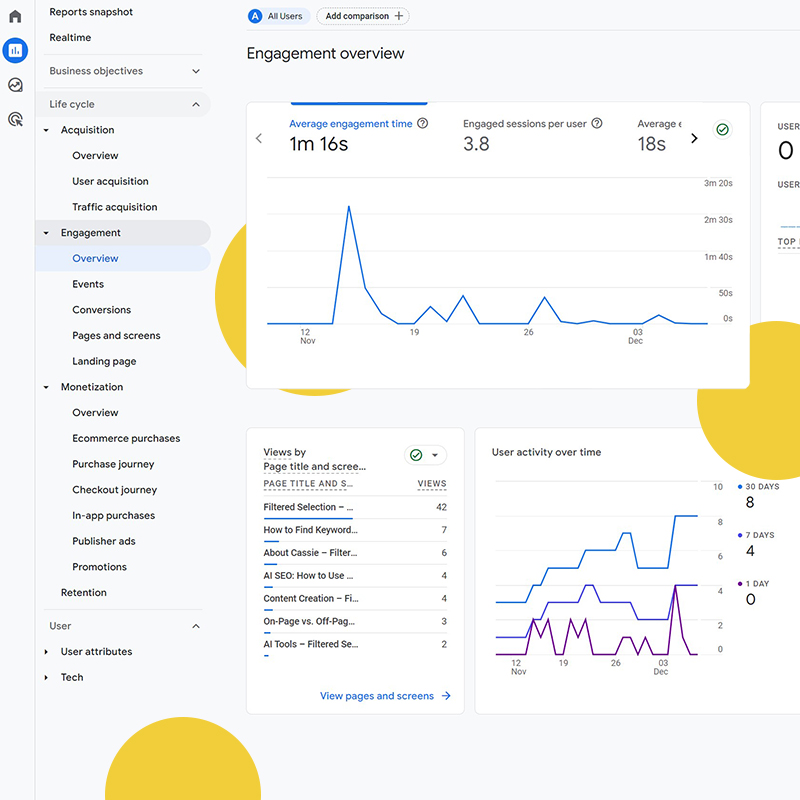
- Be Sure to Explore Other Specific User Lifecycle Reports for More Information:
- Acquisition: Insights into user acquisition channels.
- Monetization: Analysis of revenue generation from users.
- Retention: Tracking of user retention over time.
Additional Options:
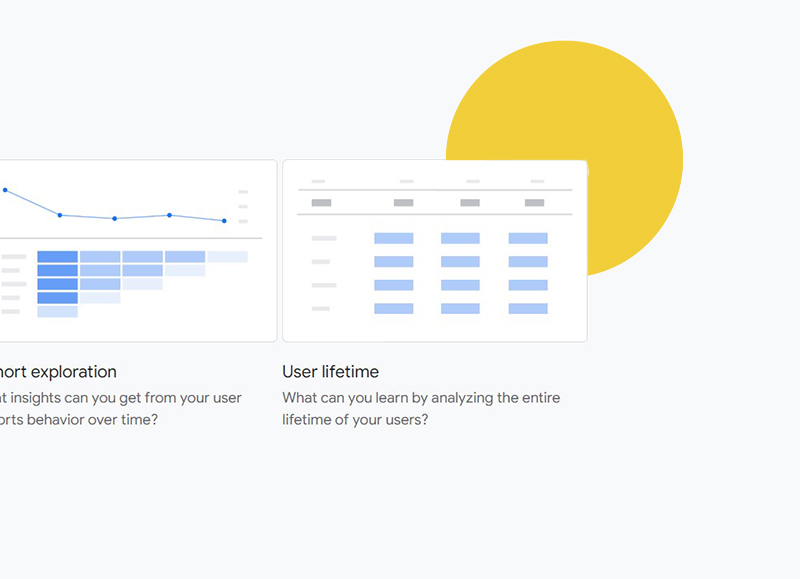
- User Lifetime Template:
- Go to “Explore” in the left-hand navigation menu.
- Click on “Template Gallery.”
- Select the “User lifetime” template.
- This allows for more customization and deeper analysis.
Tips for Running the User Lifecycle Report:
- Utilize filters to refine results by date range, user segments, and other dimensions.
- Compare different user segments or time periods using the “Compare to” feature.
- Explore advanced analysis and custom reports using the “Explore” feature.
Benefits of Running the User Lifecycle Report:
- Gain valuable insights into user behavior throughout their journey.
- Inform marketing strategies and improve user experience.
- Optimize business outcomes based on user insights.
Remember, the specific steps and available reports may vary depending on your GA4 configuration and chosen business objectives. However, by following these general guidelines, you can effectively run the User Lifecycle report and leverage its valuable insights to improve your website or app.
5. Explorations: Creating Personalized Data Visualizations
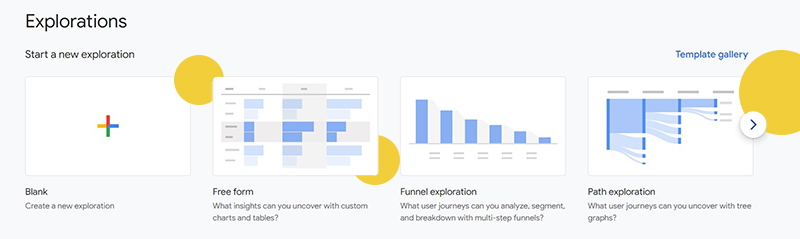
If you are wanting to create your own reports in GA4, Explorations is a great to do this.
Explorations provides a variety of reports for creating customized data visualizations and conducting in-depth data exploration. It allows you to combine different data sources, apply filters, and create charts, tables, and other visualizations to uncover deeper insights from your GA4 data.
This can also be known as the “Analysis Hub”.
Steps to Use the Analysis Hub:
- Access the Analysis Hub:
- Navigate to the “Explore” section in your GA4 account.
- Select “Free-Form” from the list of report forms, or select a previously made draft.
- You can also create a blank exploration or click on “Template Gallery” to view more options.
- Select Dimensions and Metrics:
- On the left-hand panel, drag and drop dimensions (attributes that provide context) and metrics (measurable values) onto the right-hand analysis interface “Settings”.
- Note: You can also quickly double-click your option and they will automatically move over.
- For example, you could drag “User ID” as a dimension and “Pageviews” as a metric to analyze pageviews per user.
- If you can’t find “User ID”, click the + sign and search. Once found, select it then click import.
- On the left-hand panel, drag and drop dimensions (attributes that provide context) and metrics (measurable values) onto the right-hand analysis interface “Settings”.
- Apply Filters:
- At the very bottom of “Settings”, click the “Add filter” button to narrow down the data and focus on specific segments or time periods.
- For instance, you could filter by “Country” to analyze pageviews from a particular region or filter by “Date” to compare metrics across different time frames.
- Choose Visualization Style:
- Select an appropriate visualization type, such as a bar chart, line chart, or table, to effectively present the data.
- Consider the type of data and the insights you want to convey when choosing a visualization.
- Save and Share:
- Save your personalized exploration for easy access and share it with relevant stakeholders to foster collaboration and ensure everyone is aligned with the insights derived from the data.
Examples of Analysis Hub Usage:
- Analyze user acquisition trends over time: Use a line chart to visualize the number of new users acquired per month.
- Compare pageviews across different devices: Create a bar chart to compare pageviews from desktop, mobile, and tablet users.
- Identify popular content: Use a table to list the top 10 most-viewed pages on your website.
- Track conversion funnels: Create a funnel visualization to analyze the steps users take to complete a conversion.
- Examine user engagement metrics: Use a line chart to track metrics like average session duration and bounce rate.
6. Realtime: Monitoring the Impact of Your Actions
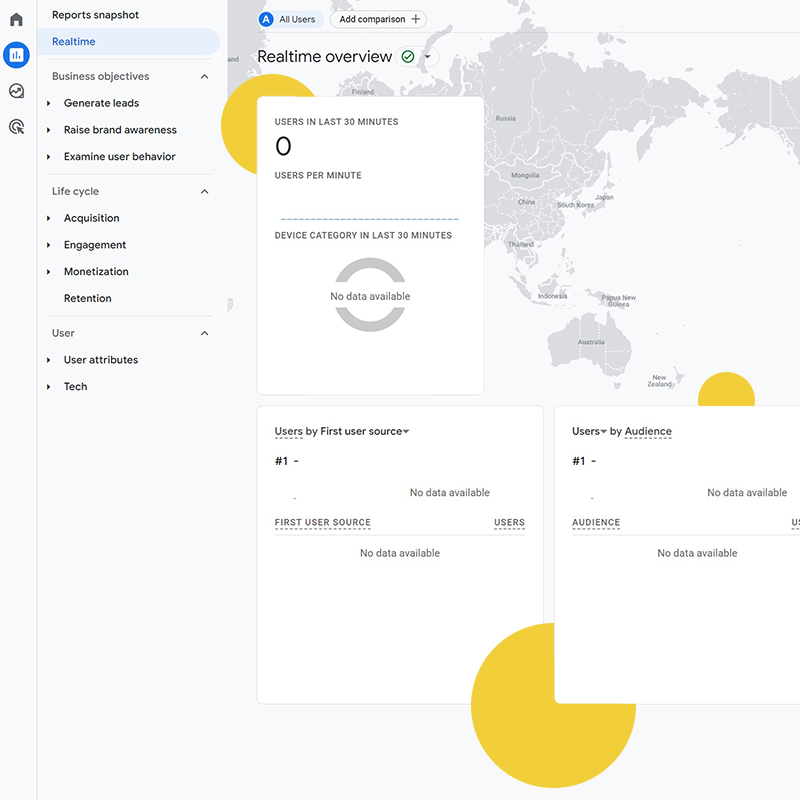
The Realtime report offers a live view of user activity on your website or app. This real-time data allows you to monitor the impact of your marketing campaigns, website changes, and other initiatives as they happen in the last 30 minutes.
Steps to Use the Realtime Report:
- Access the Report: Navigate to the “Reports” section in your GA4 account and select “Realtime” under the “Reports Snapshot” tab at the very top.
- Monitor Active Users: Observe the number of active users currently engaged with your website or app.
- Analyze Traffic Sources: Assess the real-time traffic sources, such as organic search, social media, or direct referrals.
- Track Popular Pages: Identify the most popular pages being viewed in real time.
- Monitor Events: Track the occurrence of key events in real time, such as button clicks, video plays, and form submissions.
- Adapt and Optimize: Use the real-time data to make informed decisions and adapt your marketing strategies or website elements based on immediate user behavior.
By familiarizing yourself with these six essential reports and following the step-by-step instructions, you can effectively utilize Google Analytics 4 to gain valuable insights into your website or app’s performance, user behavior, and marketing effectiveness.
Remember, the key is to start with the basics, utilize available resources, and practice consistently. With dedication and a willingness to explore, you can master GA4 to help optimize your websites or apps to achieve your business goals.
Interpreting Data in GA4 Reports
GA4 reports present a wealth of data, but it’s the interpretation that unlocks actionable insights.
Here’s a framework for interpreting GA4 reports:
- Identify Trends and Patterns: Look for consistent trends or patterns in the data, as they often reveal underlying causes or areas for improvement.
- Contextualize Data: Consider external factors that may influence the data, such as seasonality, marketing campaigns, or website updates.
- Compare Data: Benchmark your data against industry averages or previous time periods to assess your website’s performance and identify areas for growth.
- Ask Questions: Use the data to raise questions that can be further explored or tested.
- Seek Collaboration: Discuss the insights with relevant team members to gain better insight.
What is GA4 Enhanced Measurement
Google Analytics 4 (GA4) introduces Enhanced Measurement, a powerful feature that automatically tracks important user interactions, simplifying the process of collecting valuable data.
So let’s see how Enhanced Measurement works:
1. An In-depth Explanation
Enhanced Measurement takes the burden of manual event tracking off your shoulders and automatically captures essential user interactions.
It tracks events like page views, scrolls, outbound clicks, and video engagement, providing a comprehensive picture of how users are interacting with your website.
2. Automatic Tracking of Important Events like Pageviews, Scrolls, and Outbound Clicks
Gone are the days of manually setting up event tracking for every click or page view. Enhanced Measurement takes care of this, automatically recording these crucial interactions.
This not only saves time but also ensures consistent data collection across your website.
3. Simplifying Tracking for Beginners with Enhanced Measurement
For beginners venturing into the world of web analytics, Enhanced Measurement is a boon. It eliminates the complexity of manual event tracking, allowing you to focus on understanding the data and gaining actionable insights.
What is the Best Way to Learn GA4?
Anyone can learn Google Analytics 4 (GA4)!
Learning GA4 can be both exciting and challenging. Here are some recommendations to help you navigate the learning process effectively:
- Start with the Basics: Familiarize yourself with the fundamental concepts of web analytics, such as page views, sessions, bounce rate, and user engagement.
- Explore Official GA4 Resources: Google provides comprehensive documentation, tutorials, and video guides to help you learn GA4.
- Enroll in Online Courses: Numerous online courses offer structured learning opportunities to master GA4. It is recommended to get your GA4 certification at SkillShop.
- Join Online Communities: Engage with other GA4 learners and experts in online forums and communities to exchange knowledge and seek assistance.
- Practice with Real-world Examples: Apply your GA4 skills by analyzing data from your own website or a public dataset.
Frequently Asked Questions about GA4:
1. How long does it take to master GA4?
The time it takes to master GA4 depends on your individual learning pace and prior experience with web analytics. However, with dedication and consistent effort, you can gain a solid understanding of GA4 within a few months.
2. Is GA4 certification hard?
The difficulty of GA4 certification varies depending on your background and preparation. However, with thorough preparation and study, you can increase your chances of success.
BTW, I received my GA4 certificate! My tip? Be sure to learn anything that confusing or new to you outside the course 🙂 I enjoyed using Google’s Bard to help with answering questions or walking me through complicated reports.
This guide goes over how to use AI with SEO if you want more information how to programs like Bard.
3. How much does Google Analytics 4 cost?
Google Analytics 4 is available for free, making it an accessible tool for businesses of all sizes.
Google Analytics 4 Glossary
- Account: A Google Analytics 4 account is a group of properties that share the same data retention settings and access permissions.
- Admin page: The admin page is where you can manage your GA4 account and properties.
- App stability overview: The app stability overview report shows you how often your app crashes and how many errors occur.
- Audience: An audience is a group of users with similar characteristics, such as age, gender, or location.
- Cardinality: Cardinality is the number of unique values that a dimension can have. For example, the dimension “country” can have up to 250 unique values.
- Channel: A channel is the source of your traffic, such as organic search, social media, or email.
- Channel grouping: A channel grouping is a rule-based definition of your traffic sources. For example, you could create a channel grouping called “Paid Social” that includes all of your social media traffic that came from paid ads.
- Cohort: A cohort is a group of users who share a common characteristic, such as the date they first acquired your app.
- Collection: A collection is a set of data streams that you can use to measure engagement with your website or app.
- Consent checks: Consent checks are used to determine whether a user has consented to have their data collected by Google Analytics 4.
- Consent settings: Consent settings allow you to control how you collect and use user data.
- Consent state: A user’s consent state is whether they have consented to have their data collected by GA4.
- Consent type: A consent type is the type of data that a user has consented to have collected.
- Conversion event: A conversion event is an action that a user takes that is valuable to your business, such as making a purchase or signing up for a newsletter.
- Data filters: Data filters allow you to exclude data from your reports.
- Data quality: Data quality is the accuracy and completeness of your data.
- Data stream: A data stream is a source of data for your GA4 property, such as a website or app.
- Detail report: A detail report provides more information about a specific dimension or metric.
- Device ID: A device ID is a unique identifier for a user’s device.
- Dimension: A dimension is a qualitative measurement, such as country or city.
- Ecommerce: Ecommerce reports allow you to track your online sales.
- Engagement: Engagement is a measure of how users interact with your website or app.
- Event: An event is an action that a user takes, such as clicking a button or viewing a video.
- Event parameters: Event parameters are additional pieces of information about an event.
- Experiment: An experiment is a test that compares different versions of a web page or app to see which one performs better.
- Explorations: Explorations allow you to quickly analyze your data and create visualizations.
- Free-form exploration: Free-form explorations allow you to explore your data without creating a report.
- Funnel exploration: Funnel explorations allow you to see how users move through your website or app.
- GA4 Tag (AKA: gtag.js): gtag.js is a JavaScript snippet that you can use to collect data from your website.
- Google Analytics 4 property: A Google Analytics 4 property is a website or app that you want to track.
This guide is full of SEO terms every beginners needs to know, so check it out to help you on your SEO journey!
As you gain more experience in GA4, remember that the key is to start with the basics, utilize available resources, and practice consistently. With dedication and a willingness to explore, you can master GA4 to help you gain valuable insights for your website.
Be sure to let us know in the comments what your favorite reports are or what you like to use GA4 for!
Happy Optimizing 🙂
